简体中文
繁體中文
English
Pусский
日本語
ภาษาไทย
Tiếng Việt
Bahasa Indonesia
Español
हिन्दी
Filippiiniläinen
Français
Deutsch
Português
Türkçe
한국어
العربية
FPG AAPL Market Report August 4, 2025
Abstract:Apple Inc. (AAPL) traded around 202.35 on the weekly timeframe, pulling back after facing strong resistance near 214.12. The recent bearish candlestick formation suggests selling pressure is regaining
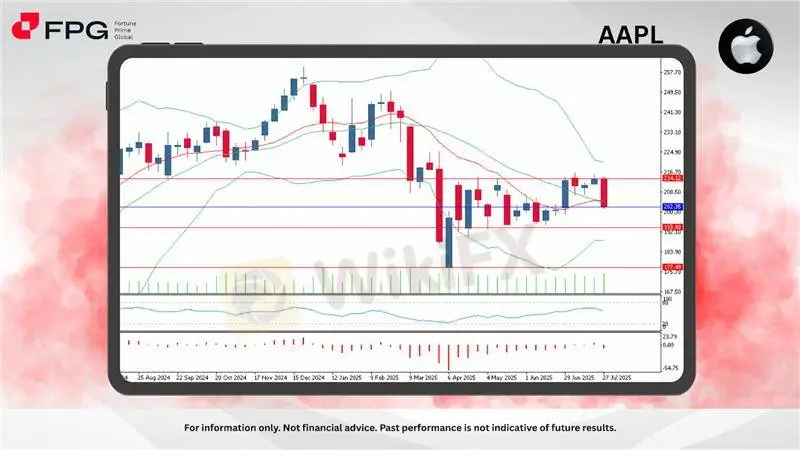
Apple Inc. (AAPL) traded around 202.35 on the weekly timeframe, pulling back after facing strong resistance near 214.12. The recent bearish candlestick formation suggests selling pressure is regaining control, especially after repeated failures to break out from the upper boundary of the range.
AAPL has remained range-bound between 193.88 and 214.12 for several weeks. The latest price rejection from the upper zone aligns with a decline in bullish momentum, as evidenced by a close below the midline of the Bollinger Bands. Price also sits below the 14-week EMA, signaling a pause or potential shift in trend.
From a volume perspective, buying interest has waned, and bearish follow-through appears to be building. The Money Flow Index (MFI) shows a reading of 55.72, indicating neutral to slightly bullish conditions but lacking strong accumulation. Bears Power currently prints at -2.12, confirming that bearish momentum is increasing, even as price remains within the consolidation zone.
The momentum outlook for AAPL is turning cautious, with the Bears Power showing negative territory and the MFI losing strength. If prices continue to hover below the mid-range and fail to retest the 208 level, further downside pressure toward the lower boundary is likely to follow. The market appears to be in a holding pattern, awaiting a catalyst.
Market Observation & Strategy Advice
1. Current Position: AAPL is currently trading around 202.35, sitting in the middle of its established range and showing signs of weakening bullish conviction.
2. Resistance: Strong resistance is found at 214.12, where repeated rejections and overbought conditions have caused bearish reversals.
3. Support: The primary support is located at 193.88, which has consistently acted as a demand zone during prior tests over the past two months.
4. Indicators: MFI is at 55.72, showing balanced flow without strong accumulation or distribution, reflecting a neutral but fragile structure. Bears Power is at -2.12, suggesting rising bearish pressure beneath the surface as sellers gradually gain control within the range.
5. Trading Strategy Suggestions:
Range Focus: Consider range-based strategies between 193.88–214.12 until a confirmed breakout or breakdown occurs.
Bias Shift Trigger: A daily or weekly close below 193.88 would confirm a bearish shift and open the door for a decline toward 177.49.
Bullish Reclaim: If bulls manage to lift price back above 208 and sustain it, retesting 214.12 becomes more likely, but momentum signals must confirm.
Market Performance:
Stocks Last Price % Change
NFLX 1,158.60 −0.07%
TSLA 302.63 −1.83%
Today's Key Economic Calendar:
TR: Inflation Rate MoM & YoY
US: Factory Orders MoM
Risk Disclaimer This report is for informational purposes only and does not constitute financial advice. Investments involve risks, and past performance does not guarantee future results. Consult your financial advisor for personalized investment strategies.
Disclaimer:
The views in this article only represent the author's personal views, and do not constitute investment advice on this platform. This platform does not guarantee the accuracy, completeness and timeliness of the information in the article, and will not be liable for any loss caused by the use of or reliance on the information in the article.
WikiFX Broker
Latest News
D. Boral Capital agrees to a fine as a settlement with FINRA
 WikiFX
Beware of Fake RS Finance: How to Spot Scams
WikiFXFortune Wave Solution: SEC Warns of Investment Scam
WikiFXForex Hedging Strategies - Calming You Amid Market Chaos
WikiFXKey Events This Week: ISM, Trade Balance And More Earnings
WikiFXWhat Is Forex Currency Trading? Explained Simply
WikiFXA Beginner’s Guide to Trading Forex During News Releases
WikiFXUltima Markets enters the UK and gains the FCA license
WikiFXLSEG Announces £1 Billion Share Buyback Program
WikiFXSEC Lawsuit Targets Real Estate Fraud Scheme by Joseph Nantomah
WikiFXCurrency Calculator

